> ## Documentation Index
> Fetch the complete documentation index at: https://docs.macropay.ai/llms.txt
> Use this file to discover all available pages before exploring further.
# Analytics
> A zero-setup dashboard for revenue, conversion, cost, and agent margin — MRR and AI COGS computed for you, no BI tool or SQL required.
Most teams treat analytics as a second project: pipe events somewhere, model them, build charts, keep them in sync. Macropay skips all of that. The moment you take your first payment, your dashboard already knows your revenue, your subscription base, your checkout funnel, and — if you're billing for AI — what each customer costs you to serve.
And because Macropay is the [merchant of record](/merchant-of-record/introduction), the figures are already clean. Sales tax and VAT are collected and remitted on your behalf, disputes and refunds are reconciled for you, so what you see is the business you actually operate — not a gross number you still have to net down by hand.
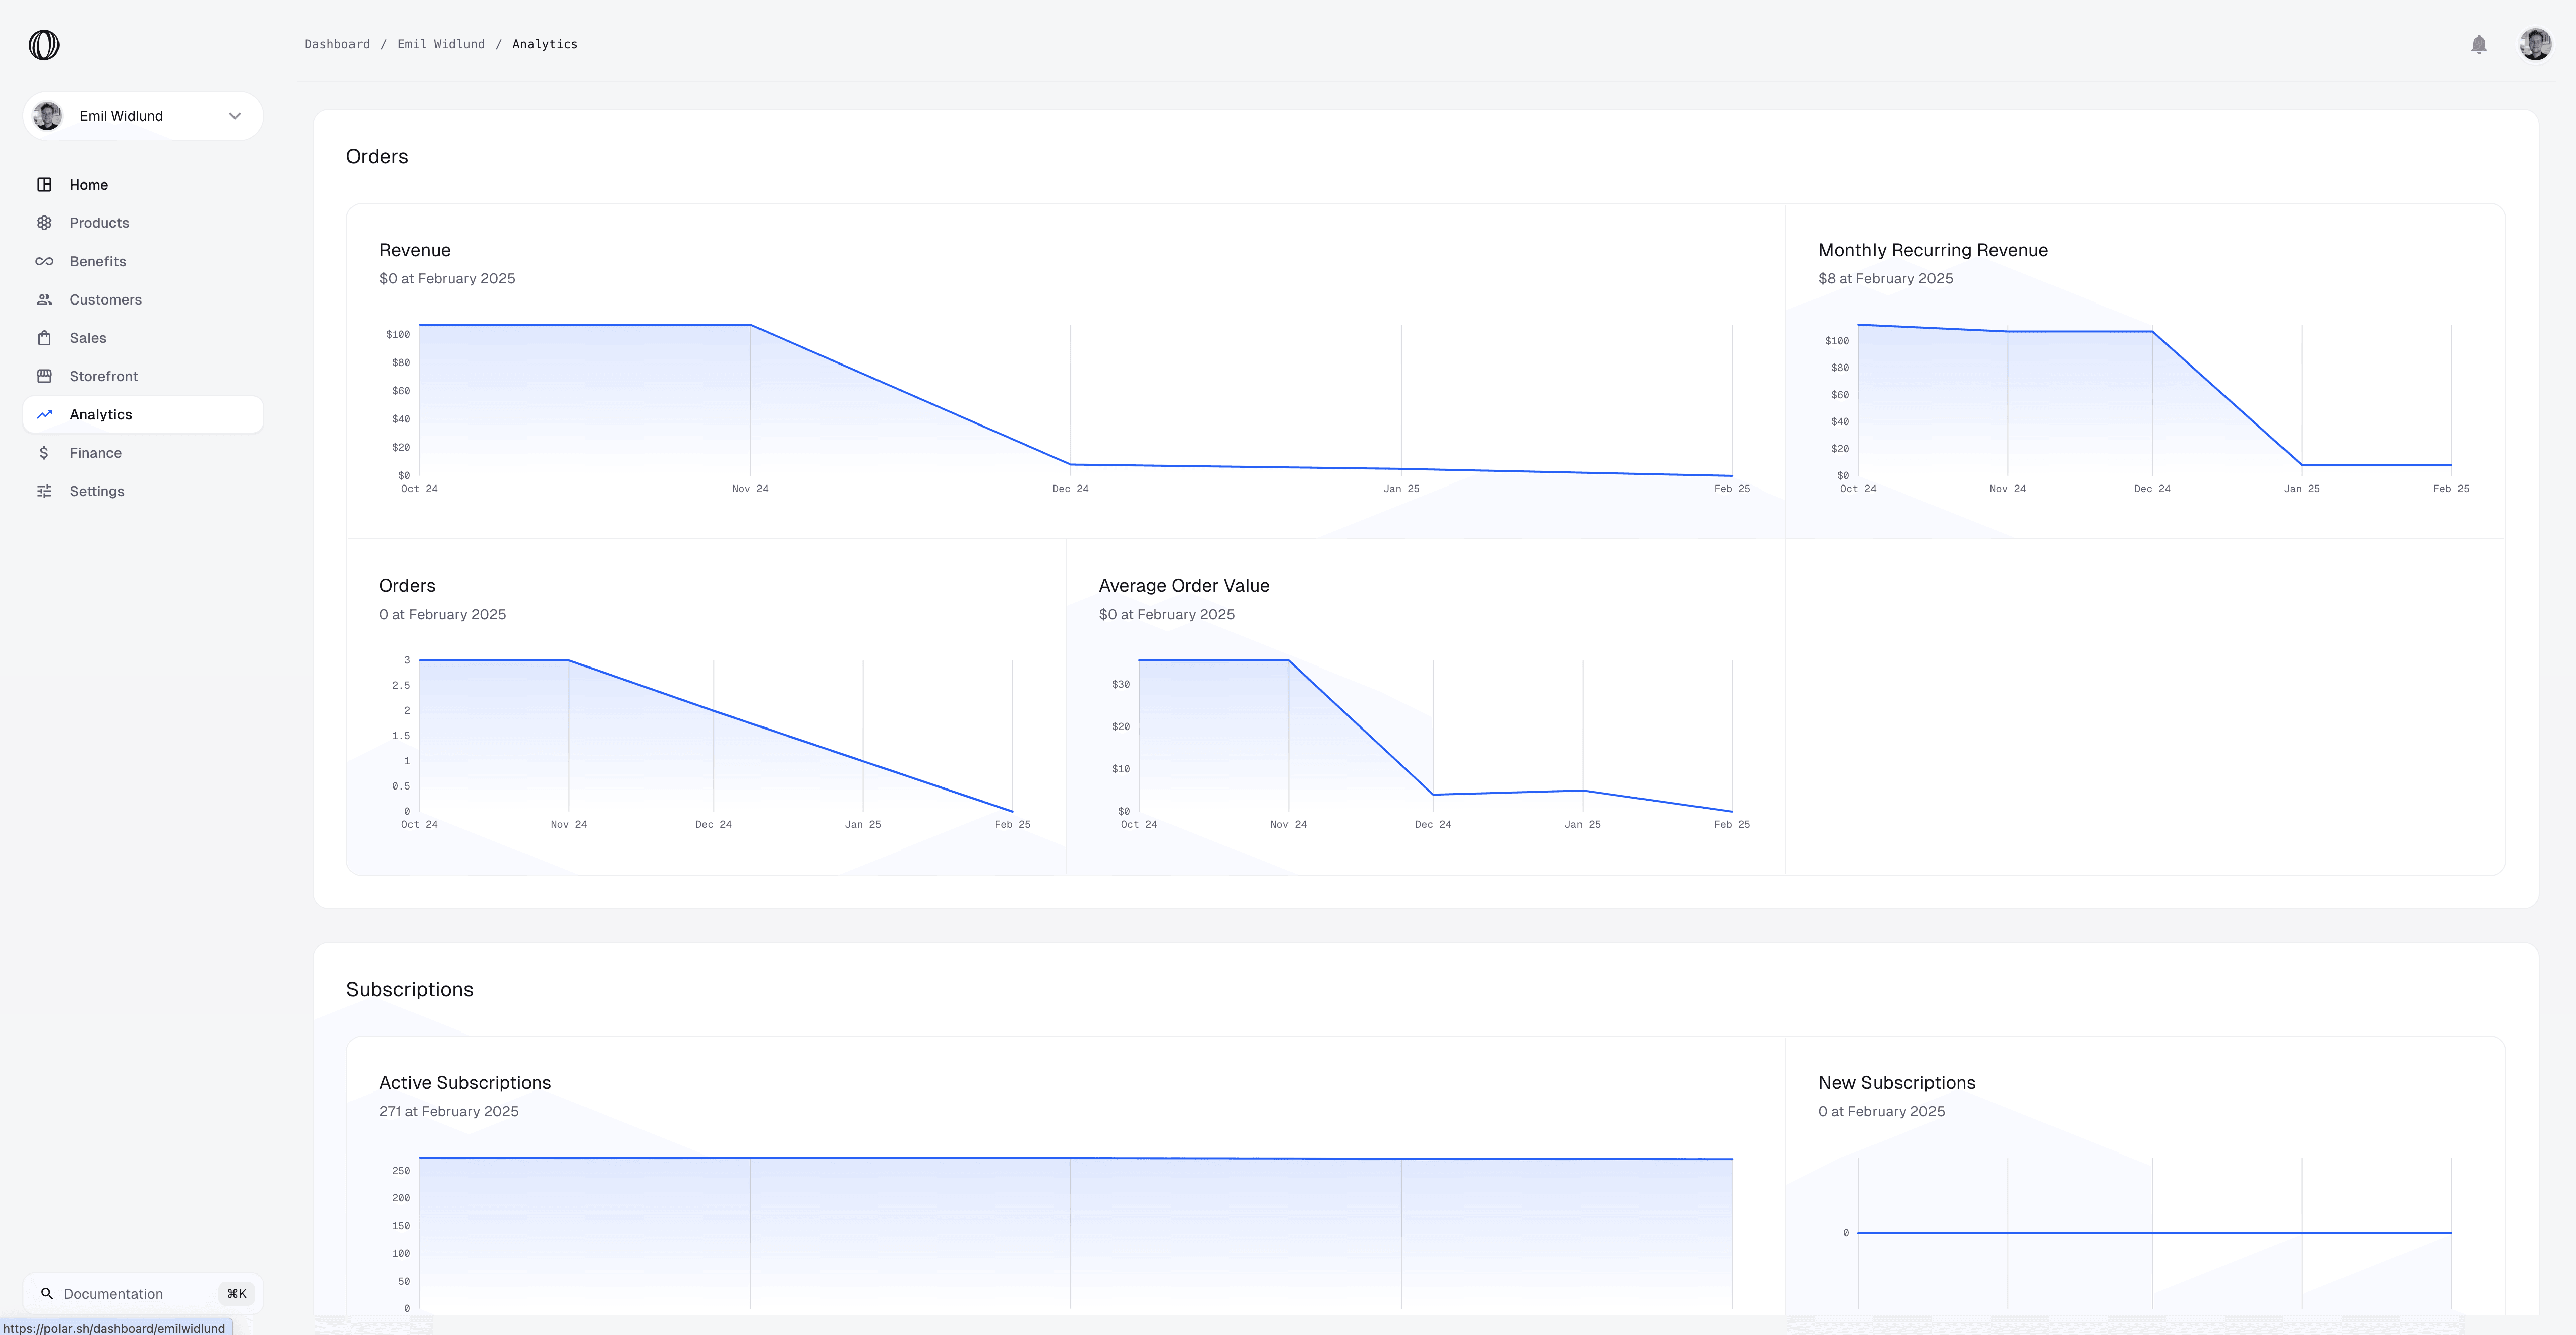
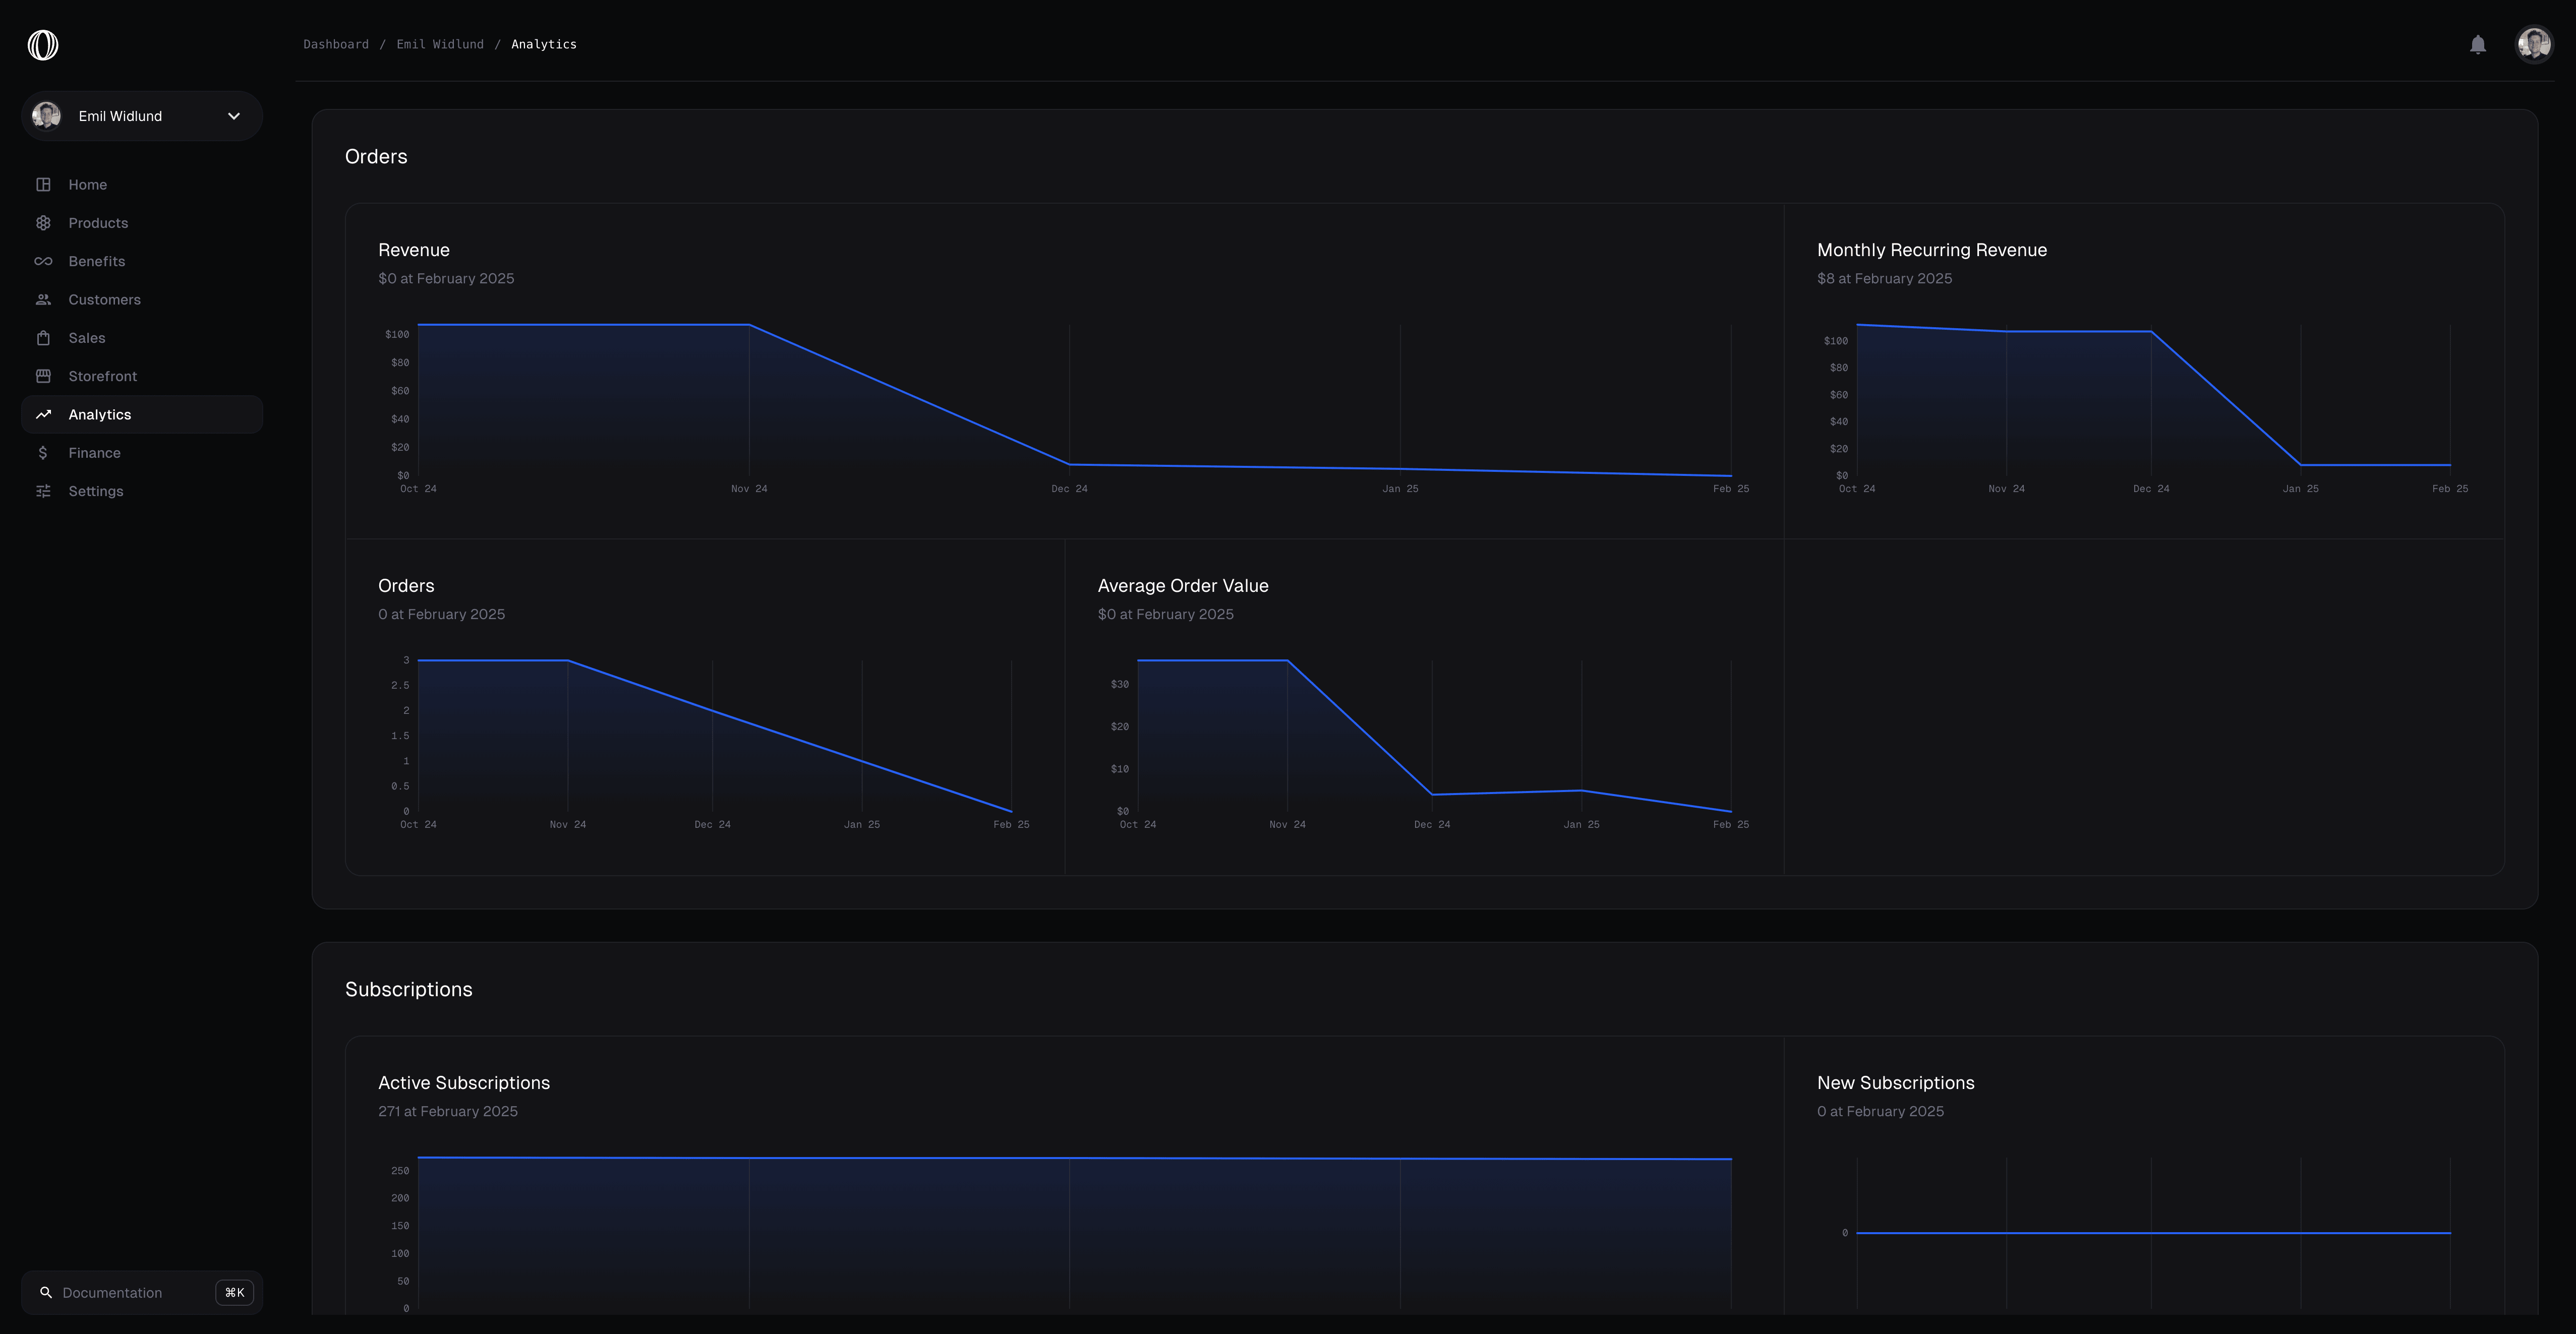 Looking for a metric we don't expose yet? [Let us know what would help](mailto:support@macropay.ai) and we'll consider adding it.
## Scope every chart with three controls
The whole dashboard responds to the same three filters. Set them once and every chart on the page redraws.
| Control | Effect |
| ------------- | ------------------------------------------------------------------------- |
| **Period** | Chooses the X-axis bucket — hourly, daily, weekly, monthly, or yearly. |
| **Timeframe** | Sets the date range the dashboard reports over. |
| **Product** | Combines all products by default; pick one product or tier to isolate it. |
Mix them to answer specific questions. Want to know whether your *Scale* tier is accelerating without the rest of the catalog drowning it out? Set the period to *weekly*, the timeframe to *last 90 days*, and the product filter to *Scale*.
## Revenue and the funnel behind it
These metrics cover money earned and the checkout flow that produces it.
| Metric | Definition |
| ----------------------------------- | -------------------------------------------------- |
| **Revenue** | Gross revenue earned, before fees. |
| **Orders** | Count of product sales and subscription payments. |
| **Average Order Value (AOV)** | Revenue ÷ orders. |
| **One-Time Products** | Number of one-time products sold. |
| **One-Time Products Revenue** | Revenue from one-time product sales. |
| **New Subscriptions** | Subscriptions started in the period. |
| **New Subscription Revenue** | Revenue from those new subscriptions. |
| **Renewed Subscriptions** | Subscriptions that renewed in the period. |
| **Renewed Subscription Revenue** | Revenue from renewals. |
| **Active Subscriptions** | New + renewed subscriptions currently active. |
| **Monthly Recurring Revenue (MRR)** | Recurring revenue across all active subscriptions. |
| **Checkouts** | Number of checkouts created. |
| **Succeeded Checkouts** | Checkouts that became an order or subscription. |
| **Checkouts Conversion Rate** | Succeeded checkouts ÷ checkouts created. |
Revenue is reported **before** Macropay's fees and gross of sales tax/VAT. As merchant of record we collect and remit that tax for you — it never enters your revenue line, and it never becomes your liability.
## Cost and margin, side by side with revenue
Profitability shouldn't live in a separate spreadsheet. Macropay tracks the cost of serving each product alongside what you charged for it, so margin is something you read off the same page as revenue. For AI and agent products — where the cost of a sale is real model spend that moves with usage — this is where the dashboard earns its keep.
| Metric | Definition |
| -------------------------------- | --------------------------------- |
| **Costs** | Total costs incurred. |
| **Cumulative Costs** | Running total of costs over time. |
| **Cost Per User** | Average cost per active user. |
| **Gross Margin** | Revenue − costs. |
| **Gross Margin Percentage** | Gross margin ÷ revenue. |
| **Net Cashflow** | Revenue − costs. |
| **Monthly Recurring Cost (MRC)** | Costs ÷ active subscriptions. |
| **Return on Investment (ROI)** | (Revenue − costs) ÷ costs. |
### Agentic margin for AI products
Bill with [usage-based pricing](/features/usage-based-billing/introduction) or run [agent billing](/features/usage-based-billing/introduction) and these cost metrics become your **agentic margin**: the revenue you booked measured against the AI cost of goods sold for each agent. You don't have to report any of that spend by hand — Macropay captures it as it happens:
* The [AI proxy](/features/llm-inference) at `/ai/v1` records token cost on every request it forwards, so the model spend behind each call is attributed automatically.
* Cost events and cost traces tie that spend back to the customer or agent that triggered it, feeding **Gross Margin** and **Cost Per User** with real numbers.
The payoff is early warning. When a power user runs a long-context agent loop a hundred times a day on a flat-rate plan, their serving cost climbs while their price doesn't — and you see the margin compress on the dashboard before it quietly erodes the quarter.
Pair the **Product** filter with the cost metrics to compare margin tier by tier. A usage-metered plan and a flat-rate plan can post identical revenue while behaving completely differently once you account for cost.
Looking for a metric we don't expose yet? [Let us know what would help](mailto:support@macropay.ai) and we'll consider adding it.
## Scope every chart with three controls
The whole dashboard responds to the same three filters. Set them once and every chart on the page redraws.
| Control | Effect |
| ------------- | ------------------------------------------------------------------------- |
| **Period** | Chooses the X-axis bucket — hourly, daily, weekly, monthly, or yearly. |
| **Timeframe** | Sets the date range the dashboard reports over. |
| **Product** | Combines all products by default; pick one product or tier to isolate it. |
Mix them to answer specific questions. Want to know whether your *Scale* tier is accelerating without the rest of the catalog drowning it out? Set the period to *weekly*, the timeframe to *last 90 days*, and the product filter to *Scale*.
## Revenue and the funnel behind it
These metrics cover money earned and the checkout flow that produces it.
| Metric | Definition |
| ----------------------------------- | -------------------------------------------------- |
| **Revenue** | Gross revenue earned, before fees. |
| **Orders** | Count of product sales and subscription payments. |
| **Average Order Value (AOV)** | Revenue ÷ orders. |
| **One-Time Products** | Number of one-time products sold. |
| **One-Time Products Revenue** | Revenue from one-time product sales. |
| **New Subscriptions** | Subscriptions started in the period. |
| **New Subscription Revenue** | Revenue from those new subscriptions. |
| **Renewed Subscriptions** | Subscriptions that renewed in the period. |
| **Renewed Subscription Revenue** | Revenue from renewals. |
| **Active Subscriptions** | New + renewed subscriptions currently active. |
| **Monthly Recurring Revenue (MRR)** | Recurring revenue across all active subscriptions. |
| **Checkouts** | Number of checkouts created. |
| **Succeeded Checkouts** | Checkouts that became an order or subscription. |
| **Checkouts Conversion Rate** | Succeeded checkouts ÷ checkouts created. |
Revenue is reported **before** Macropay's fees and gross of sales tax/VAT. As merchant of record we collect and remit that tax for you — it never enters your revenue line, and it never becomes your liability.
## Cost and margin, side by side with revenue
Profitability shouldn't live in a separate spreadsheet. Macropay tracks the cost of serving each product alongside what you charged for it, so margin is something you read off the same page as revenue. For AI and agent products — where the cost of a sale is real model spend that moves with usage — this is where the dashboard earns its keep.
| Metric | Definition |
| -------------------------------- | --------------------------------- |
| **Costs** | Total costs incurred. |
| **Cumulative Costs** | Running total of costs over time. |
| **Cost Per User** | Average cost per active user. |
| **Gross Margin** | Revenue − costs. |
| **Gross Margin Percentage** | Gross margin ÷ revenue. |
| **Net Cashflow** | Revenue − costs. |
| **Monthly Recurring Cost (MRC)** | Costs ÷ active subscriptions. |
| **Return on Investment (ROI)** | (Revenue − costs) ÷ costs. |
### Agentic margin for AI products
Bill with [usage-based pricing](/features/usage-based-billing/introduction) or run [agent billing](/features/usage-based-billing/introduction) and these cost metrics become your **agentic margin**: the revenue you booked measured against the AI cost of goods sold for each agent. You don't have to report any of that spend by hand — Macropay captures it as it happens:
* The [AI proxy](/features/llm-inference) at `/ai/v1` records token cost on every request it forwards, so the model spend behind each call is attributed automatically.
* Cost events and cost traces tie that spend back to the customer or agent that triggered it, feeding **Gross Margin** and **Cost Per User** with real numbers.
The payoff is early warning. When a power user runs a long-context agent loop a hundred times a day on a flat-rate plan, their serving cost climbs while their price doesn't — and you see the margin compress on the dashboard before it quietly erodes the quarter.
Pair the **Product** filter with the cost metrics to compare margin tier by tier. A usage-metered plan and a flat-rate plan can post identical revenue while behaving completely differently once you account for cost.