

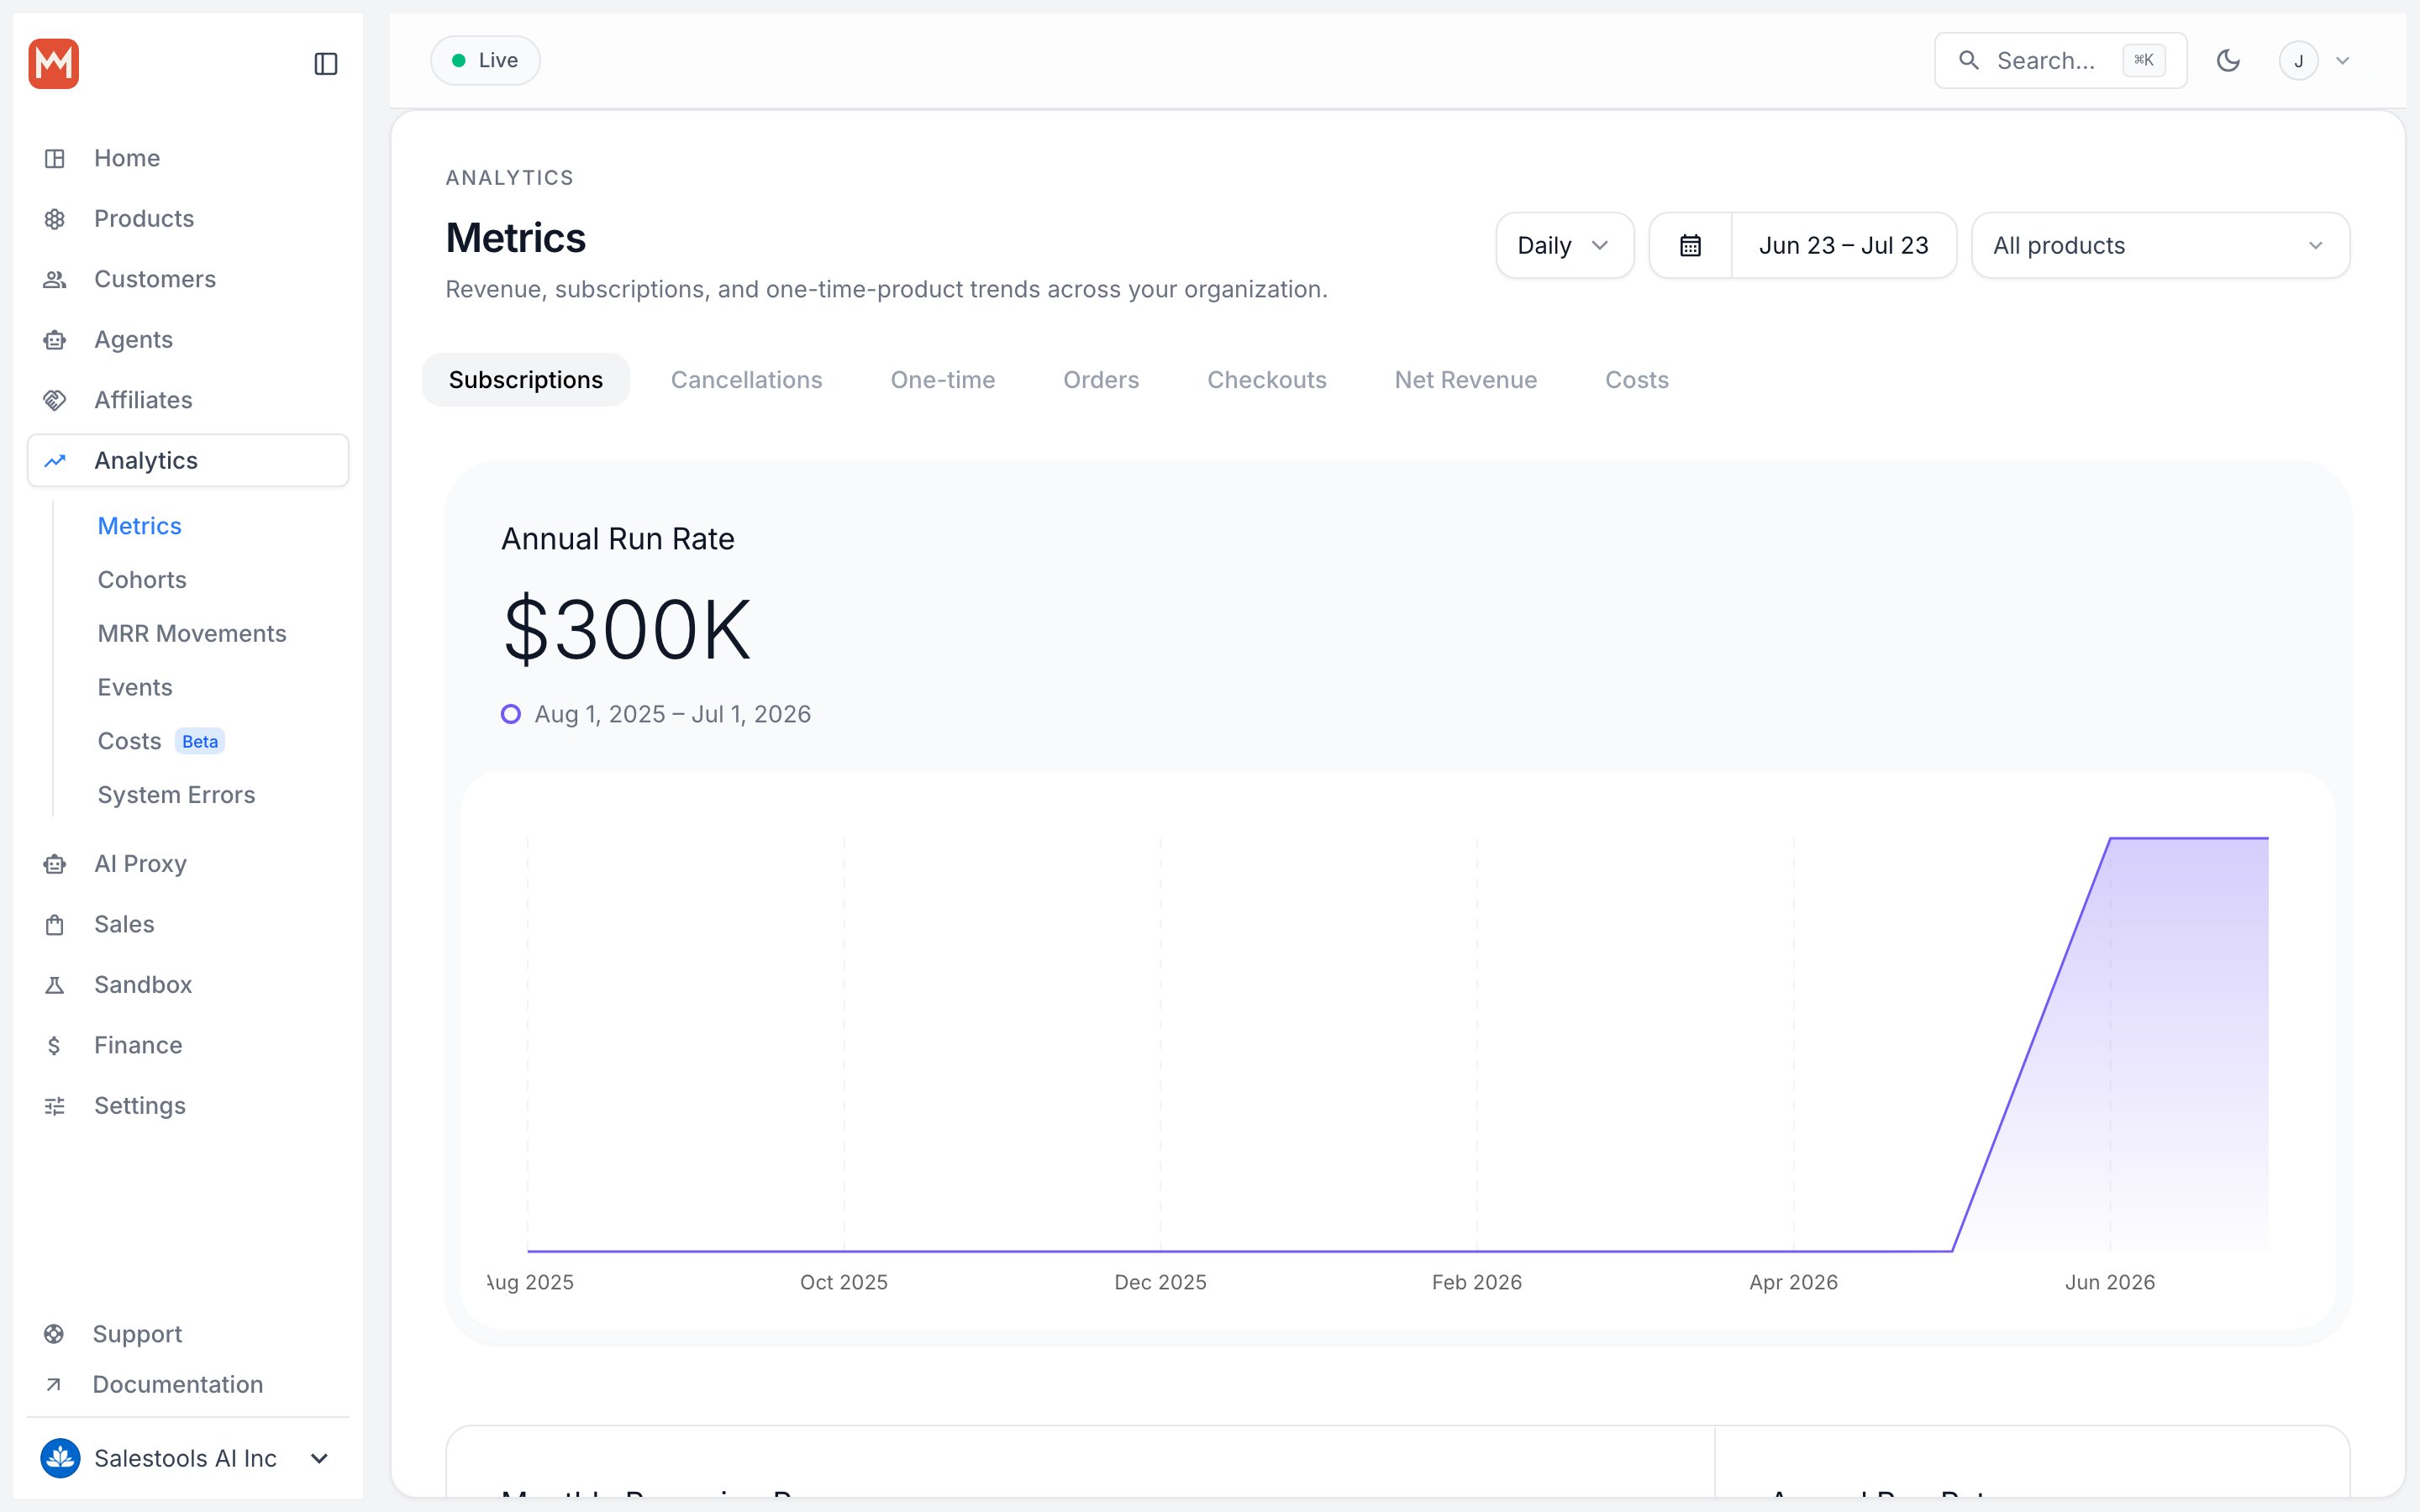
Scope every chart with three controls
The whole dashboard responds to the same three filters. Set them once and every chart on the page redraws.
Mix them to answer specific questions. Want to know whether your Scale tier is accelerating without the rest of the catalog drowning it out? Set the period to weekly, the timeframe to last 90 days, and the product filter to Scale.
Revenue and the funnel behind it
These metrics cover money earned and the checkout flow that produces it.Revenue is reported before Macropay’s fees and gross of sales tax/VAT. As merchant of record we collect and remit that tax for you — it never enters your revenue line, and it never becomes your liability.
Cost and margin, side by side with revenue
Profitability shouldn’t live in a separate spreadsheet. Macropay tracks the cost of serving each product alongside what you charged for it, so margin is something you read off the same page as revenue. For AI and agent products — where the cost of a sale is real model spend that moves with usage — this is where the dashboard earns its keep.Agentic margin for AI products
Bill with usage-based pricing or run agent billing and these cost metrics become your agentic margin: the revenue you booked measured against the AI cost of goods sold for each agent. You don’t have to report any of that spend by hand — Macropay captures it as it happens:- The AI proxy at
/ai/v1records token cost on every request it forwards, so the model spend behind each call is attributed automatically. - Cost events and cost traces tie that spend back to the customer or agent that triggered it, feeding Gross Margin and Cost Per User with real numbers.